National Electronic Injury Surveillance System
Introduction
An injury surveillance information system collects, analyzes, and distributes data on injuries to promote health care delivery. The present study aimed to review the data elements and functional requirements of this system.
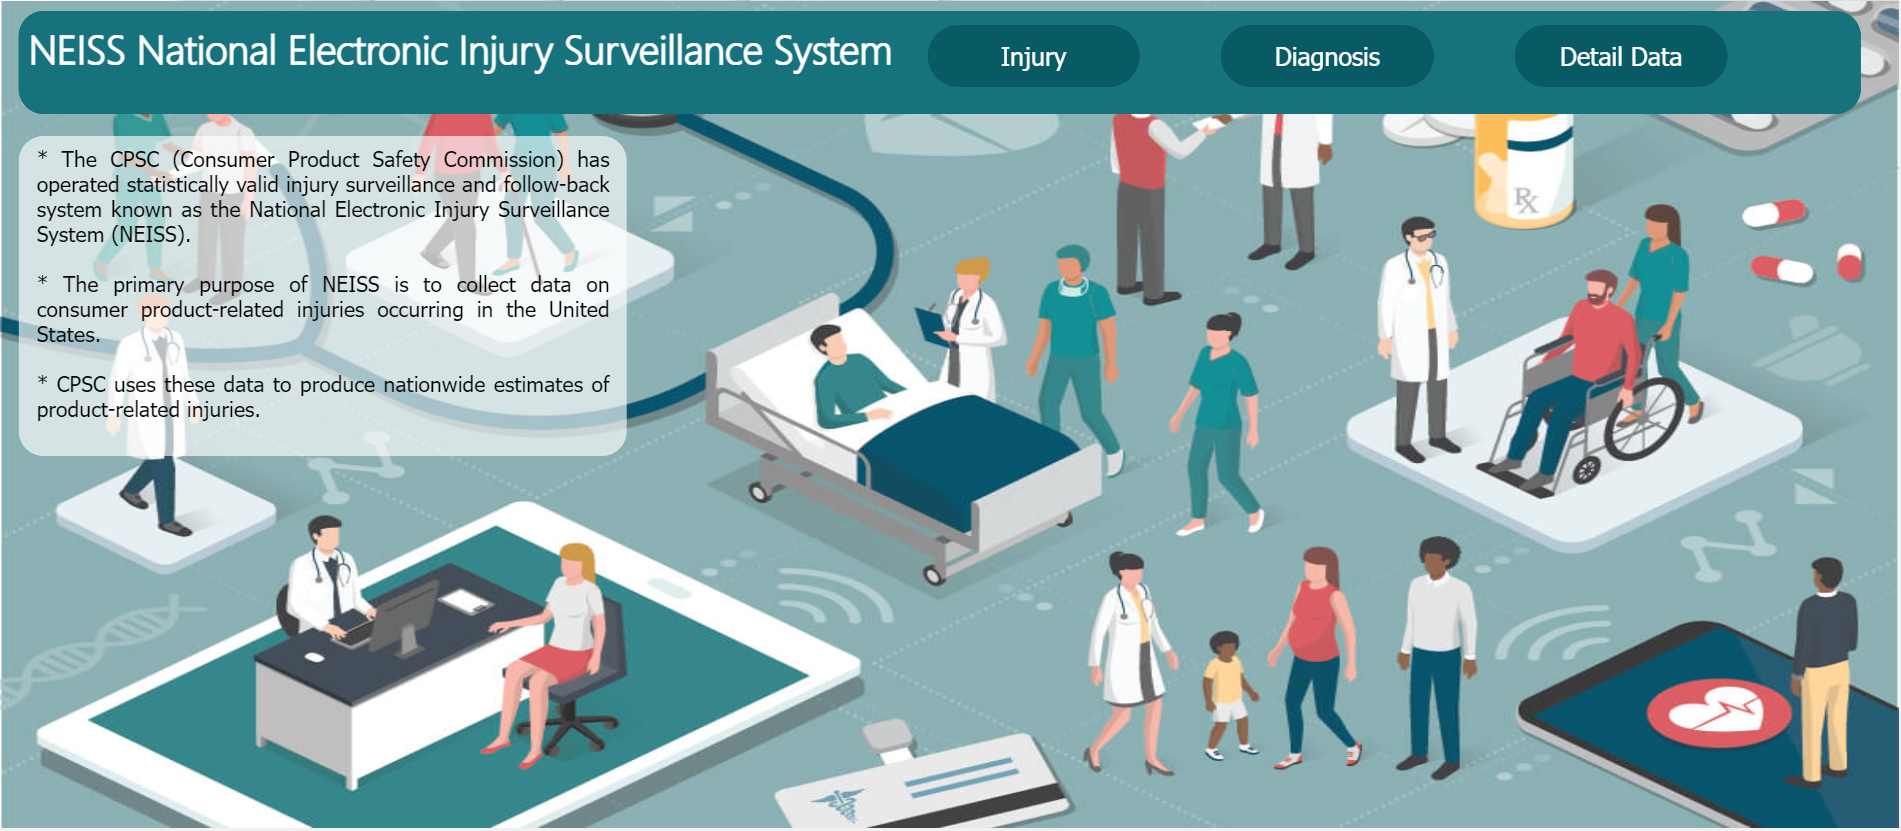
The CPSC (Consumer Product Safety Commission) has operated a statistically valid injury surveillance and follow-back system known as the National Electronic Injury Surveillance System (NEISS).
The primary purpose of NEISS is to collect data on consumer product-related injuries occurring in the United States.CPSC uses these data to produce nationwide estimates of product-related injuries.
Prerequisites:
Download and extract the “USA Electronic Injury Surveillance System.zip” file from Marketplace you should get the following folder structure.
• dashboards
• datasets
• datasources
• reports
• images
• resources
Overview Tab:
NEISS National Electronic Injury Surveillance System Title

Download InjurySurveillanceCode.zip file from here
From the right vertical menu of the dashboard select the Custom Visualization Widget and update the Properties, as below:
In HTML Properties enter the HTML code Provided in the National Electronic Injury Surveillance System Title file.
In CSS Properties enter the CSS code Provided in the National Electronic Injury Surveillance System Title file.
Go to the Widget Setting and enter the following details in Widget Border Properties:
Border: Enable

Border Radius: Enable

Border Type: None

Top Left Radius: 20

Top Right Radius: 20

Bottom Left Radius: 20

Bottom Right Radius: 20
Enter the following details in Background Properties:
Panel Background Color: #16737e

Maximize Widget Background Color: #16737e

Widget Background Color: #16737e
Enter the following details in Title Properties:
Show Title: Disable
Click on Preview and Save and Exit.
Description

From the right vertical menu select the Custom Visualization Widget and update the Properties, as below:
In HTML Properties enter the HTML code Provided in the HTML Folder >> description file.
Go to the Widget Setting and enter the details in Widget Border Properties: (Same as NEISS National Electronic Injury Surveillance System Title Widget )
Enter the following details in Background Properties:
Panel Background Color: rgba(255,255,255,0.4)

Maximize Widget Background Color: rgba(255,255,255,0.4)

Widget Background Color: rgba(255,255,255,0.4)
Enter the following details in Title Properties:
Show Title: Disable
Click on Preview and Save and Exit.
Injury Tab:
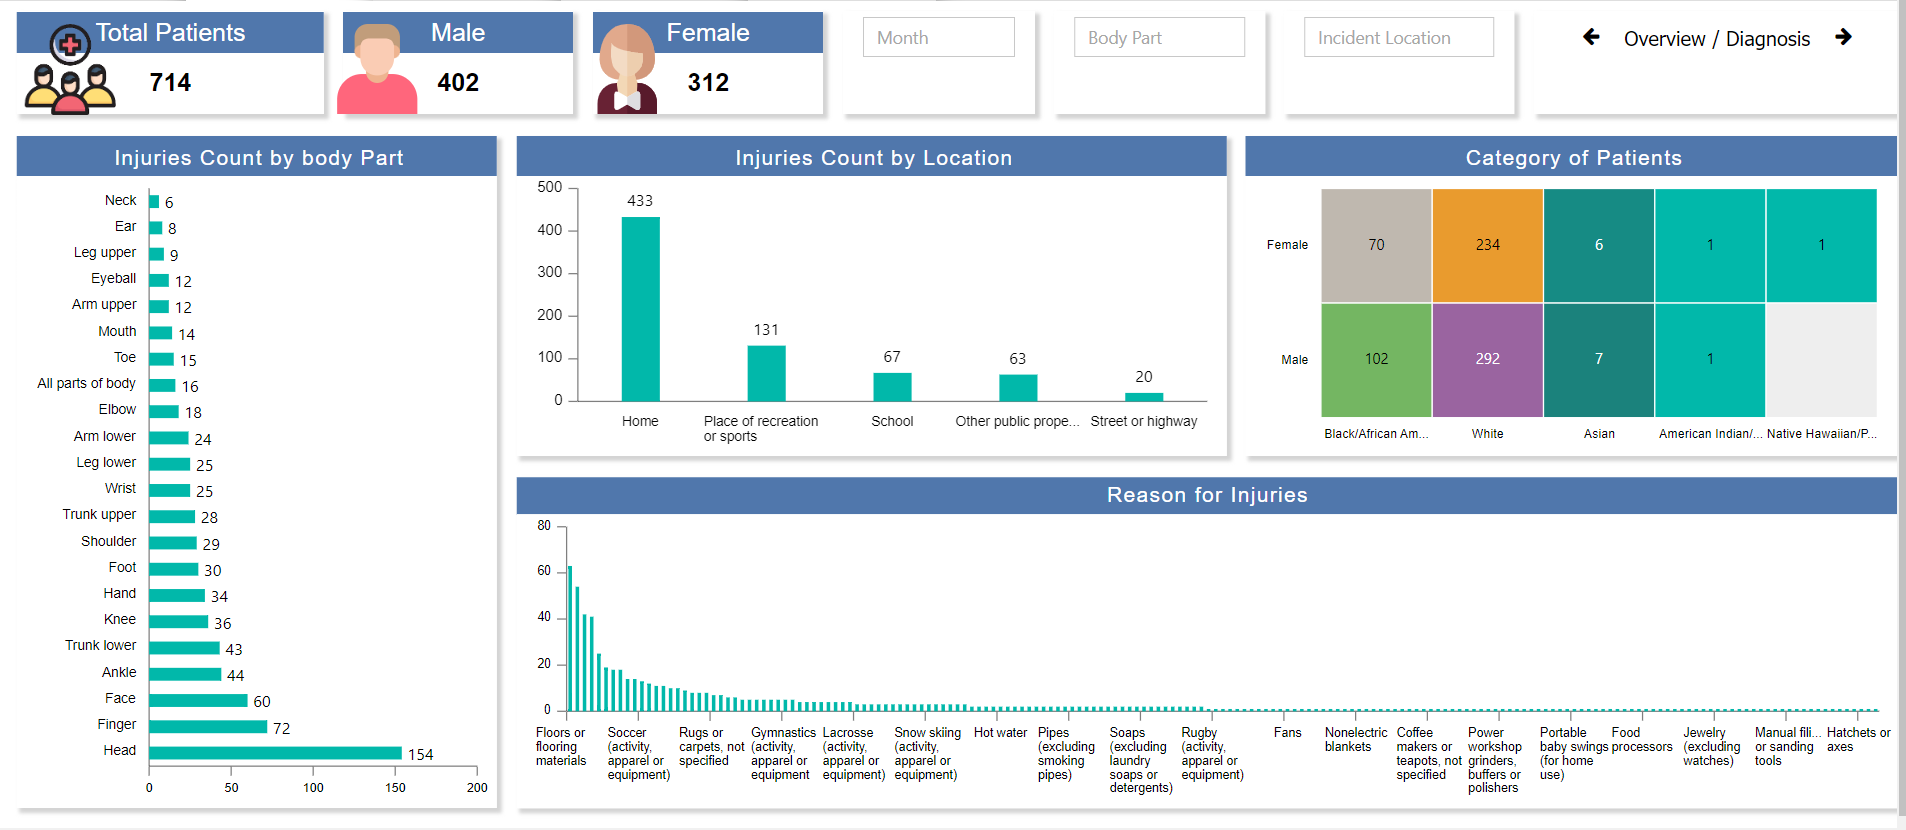
Total Patients: It displays information on the total number of Patients.
First, make the KPI Widget, and after that image & text.
From the right vertical menu select the Card Widget and update the card Properties, as below:
Name: Total Patients

Dataset: USA NEISS Data
Enter the following details in Card General Property
Select Columns: CPSC Case Number

Aggregation: Count
Enter the following details in Style Property
Paddding: 12
Enter the following details in Formatting Property
Decimal Place: 0
Enter the following details in Title Property
Title: Total Patients

Title Position: Top

Background Color: #5077ac

Title Font Color: #ffffff

Title Font Weight: Normal
Go to the Widget Setting and enter the following details in Widget Box Shadow Properties:
Box Shadow: Enable

Box Shadow Horizontal: 3

Box Shadow Vertical: 3

Box Shadow Color: #d3d3d3

Box Shadow Blur: 3
Enter the following details in Widget Icon Properties:
Hide Icon In Preview: Disable

Hide Maximize Icon: Enable

Hide Download Icon: Enable
Enter the following details in Widget Internal Area Properties:
Internal Area Padding: 0px 0px
Enter the following details in Background Properties:
Panel Background Color: rgba(255,255,255,0)

Maximize Widget Background Color: rgba(255,255,255,0)
Widget Background Color: rgba(255,255,255,0)
Enter the following details in Title Properties:
Show Title: Disable
Click on Save and Exit.
KPI looks like this, as shown in the figure below:

Click on Save and Exit.
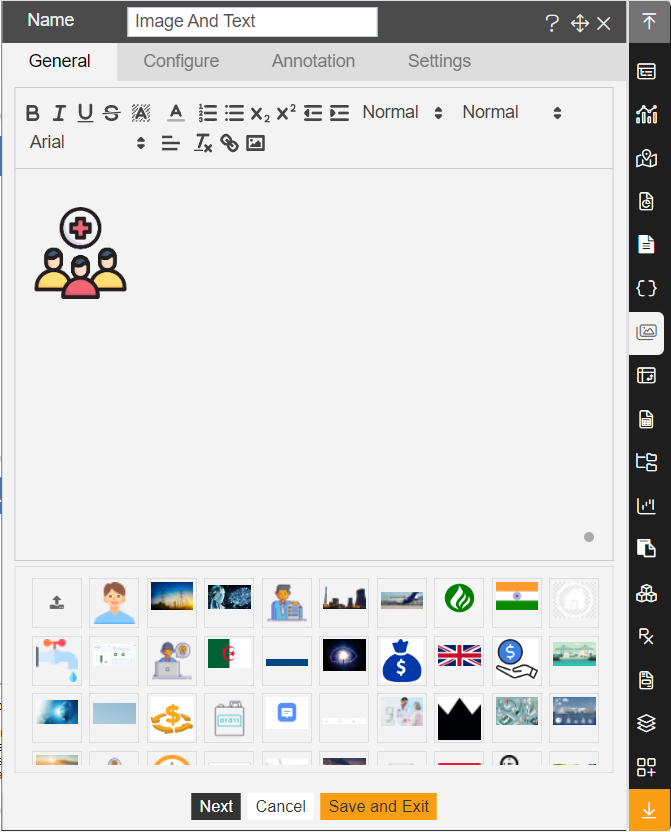
Total Patients: Image & Text

From the right vertical menu select the Image & Text Widget.
Select Image from the images Drag and Drop Image in entering Text, as shown in the figure below:
Go to the Widget Setting and enter the following details in Background Properties:
Panel Background Color: rgba(255,255,255,0)

Maximize Widget Background Color: rgba(255,255,255,0)

Widget Background Color: rgba(255,255,255,0)
Enter the following details in Title Properties:
Show Title: Disable
Click on Save and Exit.
Click on the Ellipse icon ![]() of the widget and select the Bring forward option, Put it in the Appropriate position on the Total Patients KPI Widgets.
of the widget and select the Bring forward option, Put it in the Appropriate position on the Total Patients KPI Widgets.
Click on Ellipse icon ![]() of the Total Patients KPI widget and select the copy option.
of the Total Patients KPI widget and select the copy option.
It will display the dialog box, as shown in the figure below:
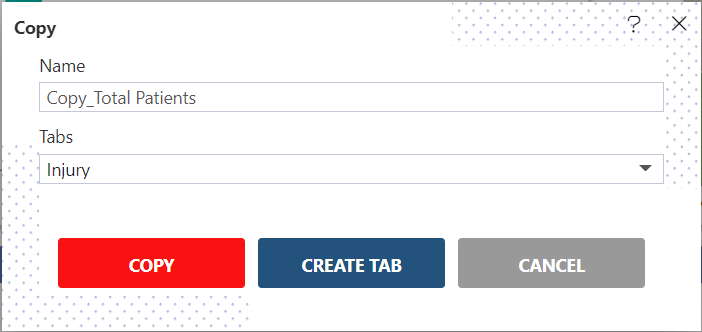
Click on the copy.
Male: It displays a total number of Male Patients.

First, make the KPI Widget, and after that image & text.
From the right vertical menu select the Card Widget and update the card Properties, as below:
Enter the following in detail in the Male KPI widget.
Client Script: Enable (Client script provided in **male** file)

Dataset: USA NEISS Data
Enter the following details in Card General Property.
Select Column: Sex

Aggregation: Count
Enter the following details in Title Property.
Title: Male
Click on Save and Exit.
Male KPI looks like this, as shown in the figure below:

Male: Image & Text
From the right vertical menu select the Image & Text Widget.
Select a male Image from the images Drag and Drop Image in entering Text:
Go to the Widget Setting and enter the details same as Total Patients Image & Text Widget.
Click on Save and Exit.

Click on the Ellipse icon ![]() of the widget and select the Bring forward option, Put it in the Appropriate position on the Male Image & Text KPI Widgets.
of the widget and select the Bring forward option, Put it in the Appropriate position on the Male Image & Text KPI Widgets.
Female: It displays a total number of Female Patients.

First, make the KPI Widget, and after that image & text.
Click on the Ellipse icon ![]() of the Male KPI widget and select the copy option.
of the Male KPI widget and select the copy option.
Client Script: Enable (Client script provided in **female** file)
Enter the following details in Title Property.
Title: Female
Click on Save and Exit.
Female: Image & Text
From the right vertical menu select the Image & Text Widget.
Select Female Image from the images Drag and Drop Image in entering Text:
Go to the Widget Setting and enter the details same as Total Patients Image & Text Widget.
Click on Save and Exit.
Female KPI looks like this, as shown in the figure below:

Injuries Count by body Part: It displays the count of injuries by body parts.
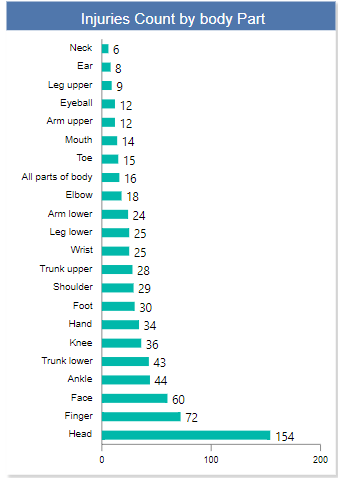
From the Right vertical menu select the chart widget and enter the following details in clustered Bar Chart Property.
Name: Injuries Count by body Part

Dataset: USA NEISS Data.ds

Client Script: Enable (Client script provided in **energy utilized by type** file)

Category Axis: Body Part

Value Column: sex

Aggregation: Count
Go to the Formatting property and enter the following details in General.
Chart Sorting based on Value: Descending

Chart Cursor: Disable Line X, Line Y
Enter the following details in the Category Axis Property.
Category Font Property >> Font Size: 11

Category Ticks: Disable
Enter the following details in Series Property.
Series General Properties >> Series Name: Body Part

Series Value Label Position: Enable

Font Size: 13

Decimal Places: 0
Go to the Widget Setting and enter the following details in Widget Box Shadow Properties:
Box Shadow: Enable

Box Shadow Horizontal: 3

Box Shadow Vertical: 3

Box Shadow Color: #d3d3d3

Box Shadow Blur: 3
Enter the following details in Widget Icon Properties:
Hide Icon In Preview: Disable

Hide Maximize Icon: Enable

Hide Download Icon: Enable
Enter the following details in Title Properties:
Title Move To: Center

Title Font Size: 17

Title Color: #ffffff

Title Background Color: #5077ac

Padding: 8px 4px 4px 8px
Enter the following details in Filter Properties:
Show Filter Value: Enable
Click on Save and Exit.
Injuries Count by Location: It displays injured Patients by their location

From the Right vertical menu select the chart widget and enter the following details in clustered column Chart Property.
Name: Injuries Count by Location

Dataset: USA NEISS Data.ds

Category Axis: incident location

Value Column: sex

Aggregation: Count
Go to the Formatting property and enter the following details in General.
Chart Sorting based on Value: Descending

Chart Cursor: Disable Line X, Line Y
Enter the following details in theCategory Axis Property.
Category Labels >> Alignment : Wrap

Category Font Property >> Font Size: 11

Category Ticks: Disable
Enter the following details in Series Property.
Series General Properties >> Series Name: Injury Location

Column Width: 55

Series Value Label Position: Enable

Font Size: 13

Decimal Places: 0
Go to the Widget Setting and enter the details same as Injuries Count by body Part widget Property.
Category of Patients: It displays Patient's categories by their Gender.

From the right vertical menu select the chart widget and enter the following details in Heatmap.
Name: Category of Patients

Dataset: USA NEISS Data .ds

Category Axis: Race

Y Series: Sex

Value Column: CPSC Case Number

Aggregation: Count
Go to the Formatting property and enter the following details in General.
Chart Tooltip >> Tooltip Text: args.yLabel : args.xLabel - args.value
Enter the following details in the Category Axis Property.
Category Labels >> Alignment: Trim
Go to the Widget Setting and enter the details same as Injuries Count by body Part widget Property.
Click on Save and Exit.
Reason for Injuries: It displays the reason for the Patients Injury.
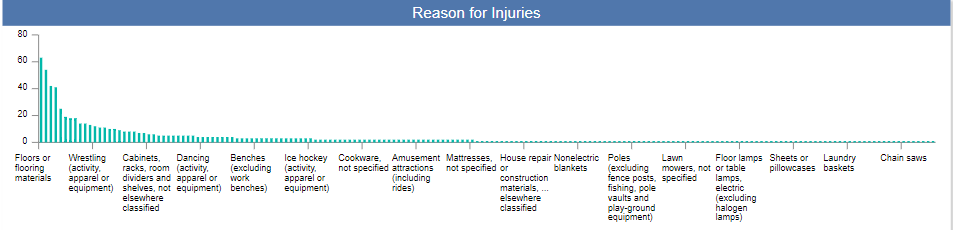
From the Right vertical menu select the chart widget and enter the following details in Stacked column Chart Property.
Name: Reason for Injuries

Dataset: USA NEISS Data.ds

Category Axis: Product

Value Column: Body Part Code

Aggregation: Count
Go to the Formatting property and enter the following details in General.
Chart Sorting based on Value: Descending
Enter the following details in the Category Axis Property.
Category Labels >> Alignment : Wrap
Enter the following details in Series Property.
Series General Properties >> Series Name: Reason for Injuries
Go to the Widget Setting and enter the details same as Injuries Count by body Part widget Property.
Click on Save and Exit.
Month Filter: It displays the list of the Month.
![]()
From the top right corner of the dashboard click on the filter Icon ![]() .
.
Click on + Icon ![]() to add filter and enter following details in it.
to add filter and enter following details in it.
Name: Month

Event: On Change
Click on the Setting icon and enter the following details in the Filter widget.
Source: Dataset

Display Type: MultiSelect

Dataset: USA NEISS Data

Column_Name: Treatment Month

Show Name in Widget: Disable
Enter the following details in the Link Filter and widget Property.
Layer: Layer1

Tab: Injury, Diagnosis, Detail Data

Widgets: (Select all the widgets one by one and link the Treatment Month column with all the widgets)
Go to the Filter Property and add Body Part, Incident Location, Diagnosis, Gender, Race, Incident Location Filter.
Body Part Filter: It displays the list of the Body Parts.
Add Body Part filter and enter the following details in it.
![]()
Name: Body Part

Event: On Change
Click on the Setting icon and enter the following details in the Filter widget.
Source: Dataset

Display Type: MultiSelect

Dataset: USA NEISS Data

Column_Name: Body Part

Show Name in Widget: Disable
Enter the following details in the Link Filter and widget Property.
Layer: Layer1

Tab: Injury, Diagnosis, Detail Data

Widgets: (Select all the widgets one by one and link the Body Part column with all the widgets)
Incident Location Filter: It displays the list of the Incident locations, where patients were injured.
Add Incident Location filter and enter the following details in it.

Name: Incident Location

Event: On Change
Click on the Setting icon and enter the following details in the Filter widget.
Source: Dataset

Display Type: MultiSelect

Dataset: USA NEISS Data

Column_Name: Incident Location

Show Name in Widget: Disable
Enter the following details in the Link Filter and widget Property.
Layer: Layer1

Tab: Injury, Diagnosis, Detail Data

Widgets: (Select all the widgets one by one and link the Incident Location column with all the widgets)
Go to the filter View Property, Click on the + icon of Month, Body Part, and Incident Location filter to add a filter in the Injury Tab of the dashboard.
Diagnosis Filter:
Diagnosis Filter: It displays the list of the Diagnosis of Injury.
Add Diagnosis filter and enter the following details in it.

Name: Diagnosis

Event: On Change
Click on the Setting icon and enter the following details in the Filter widget.
Source: Dataset

Display Type: MultiSelect

Dataset: USA NEISS Data

Column_Name: Diagnosis

Show Name in Widget: Disable
Enter the following details in the Link Filter and widget Property.
Layer: Layer1

Tab: Injury, Diagnosis, Detail Data

Widgets: (Select all the widgets one by one and link the Diagnosis column with all the widgets)
Go to the filter View Property, Click on the + icon of Diagnosis filter to add a filter in the Diagnosis tab of the dashboard.
Gender Filter:
Gender Filter: It displays the Gender.
Add a Gender filter and enter the following details in it.
Name: Sex

Event: On Change
Click on the Setting icon and enter the following details in the Filter widget.
Source: Dataset

Display Type: MultiSelect

Dataset: USA NEISS Data

Column_Name: Sex

Show Name in Widget: Disable
Enter the following details in the Link Filter and widget Property.
Layer: Layer1

Tab: Injury, Diagnosis, Detail Data

Widgets: (Select all the widgets one by one and link the Sex column with all the widgets)
Year Filter:
Year Filter: It displays the list of Years.
Add the Year filter and enter the following details in it.
![]()
Name: Year

Event: On Change
Click on the Setting icon and enter the following details in the Filter widget.
Source: Dataset

Display Type: MultiSelect

Dataset: USA NEISS Data

Column_Name: Year

Show Name in Widget: Disable

Enter the following details in the Link Filter and widget Property.

Layer: Layer1

Tab: Injury, Diagnosis, Detail Data

Widgets: (Select all the widgets one by one and link the Year column with all the widgets)
Race Filter: It displays the Category of Patients.
Add Race filter and enter the following details in it.

Name: Race

Event: On Change
Click on the Setting icon and enter the following details in the Filter widget.
Source: Dataset

Display Type: MultiSelect

Dataset: USA NEISS Data

Column_Name: Race

Show Name in Widget: Disable
Enter the following details in the Link Filter and widget Property.
Layer: Layer1

Tab: Injury, Diagnosis, Detail Data

Widgets: (Select all the widgets one by one and link the Race column with all the widgets)
Go to the filter View Property, Click on the + icon of Month, Gender, Body Part, Year, Race, Diagnosis, Incident Location filter to add a filter in the Detail Data Tab of the dashboard.
Overview / Diagnosis Button: Custom Visualization

From the right vertical menu select the Custom Visualization Widget and update the Properties, as below:
In HTML Properties enter the HTML code Provided in the overview-diagnosis button file.
Go to the Widget Setting and enter the details same as Injuries Count by body Part widget Property.
Click on Preview and Save and Exit.
Diagnosis Tab:
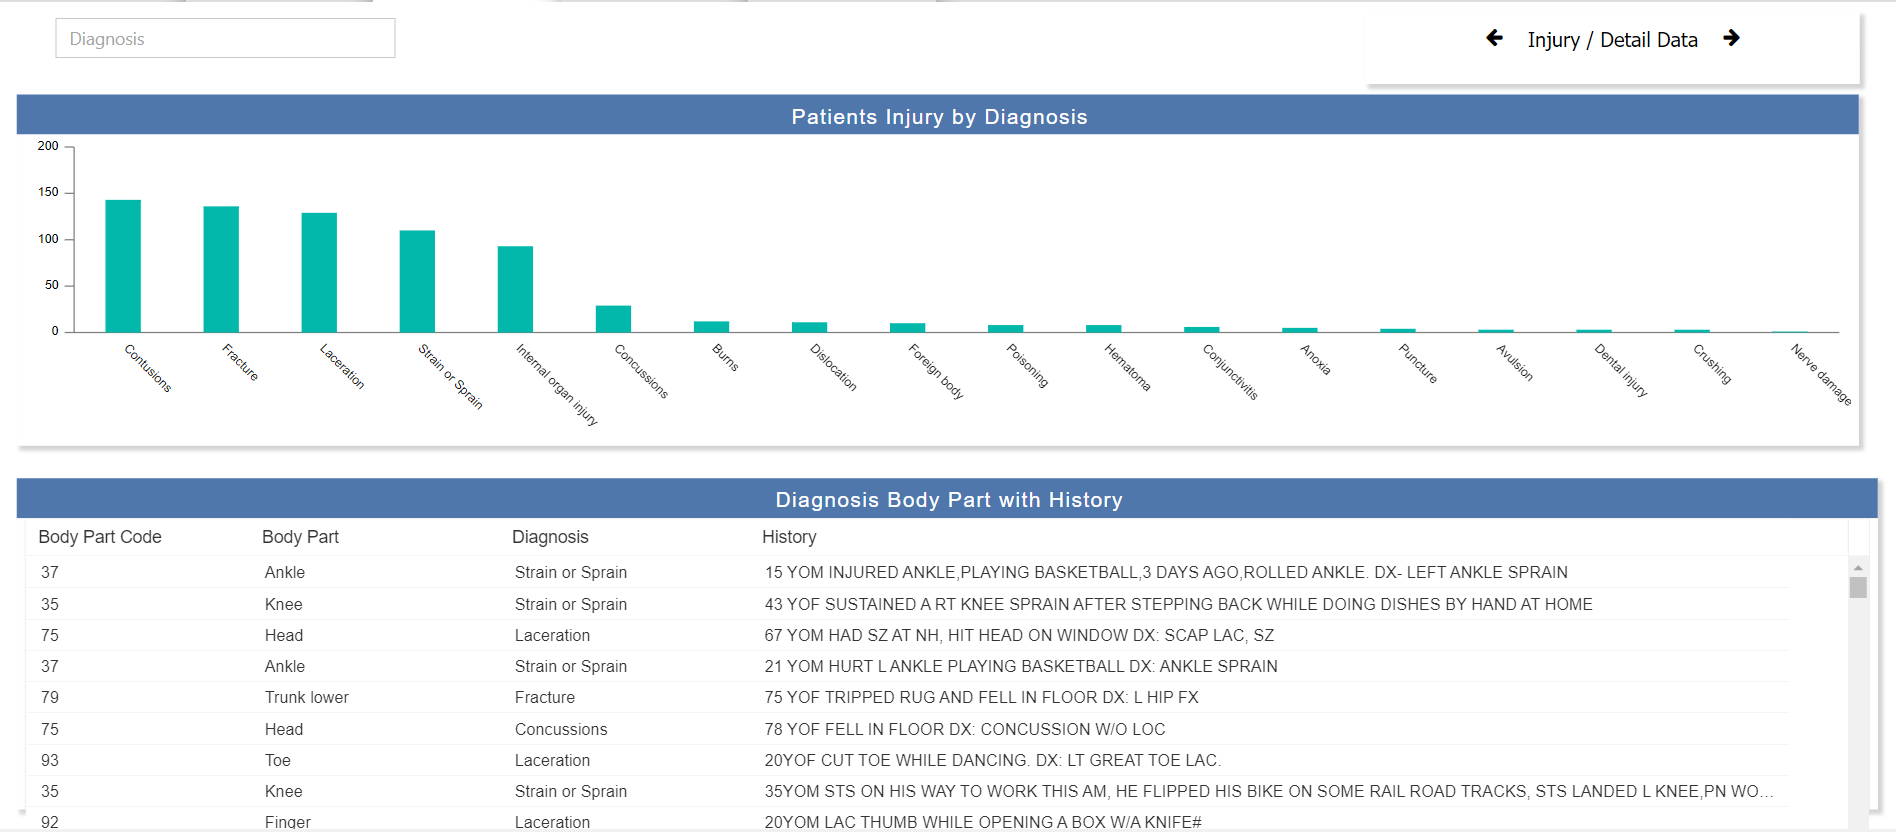
Patients Injury by Diagnosis: It displays the diagnosis of Patients Injury.
From the Right vertical menu select the chart widget and enter the following details in Stacked column Chart Property.
Name: Patients Injury by Diagnosis

Dataset: USA NEISS Data.ds

Category Axis: Diagnosis

Value Column: Sex

Aggregation: Count
Go to the Formatting property and enter the following details in General.
Chart Sorting based on Value: Descending
Enter the following details in the Category Axis Property.
Category Ticks: Disable Ticks
Enter the following details in Series Property.
Series General Properties >> Series Name: Diagnosis
Go to the Widget Setting and enter the details same as Injuries Count by body Part widget Property.
Click on Save and Exit.
Diagnosis Body Part with History: It displays information on Body Part Code, Body Part, Diagnosis, and Patients history.
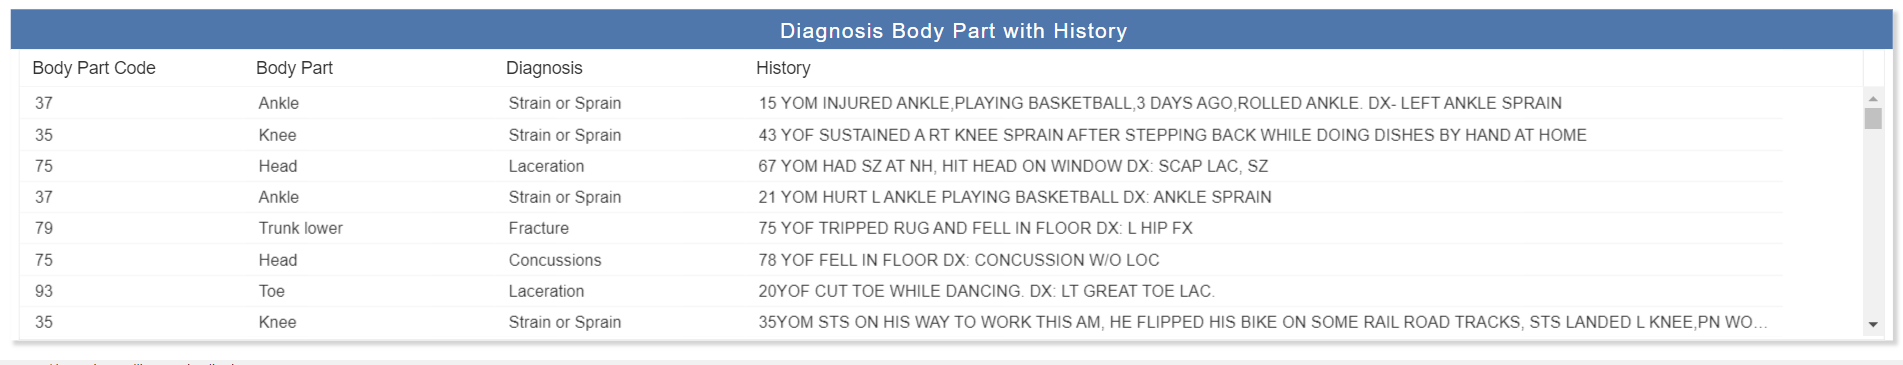
From the Right vertical menu select the Table widget and enter the following details in General Property.
Name: Diagnosis Body Part with History

Dataset: USA NEISS Data.ds

Dataset Column Select Body Part Code, Body Part, Diagnosis, and Patients history columns.
Go to the Widget Setting and enter the details same as Injuries Count by body Part widget Property.
Click on Save and Exit.
Injury / Detail Data Button:
From the right vertical menu of the dashboard select the Custom Visualization Widget and update the Properties, as below:
In HTML Properties enter the HTML code Provided in the overview-diagnosis button file.
Go to the Widget Setting and enter the details same as Injuries Count by body Part widget Property.
Click on Save and Exit.
Detail Data Tab:
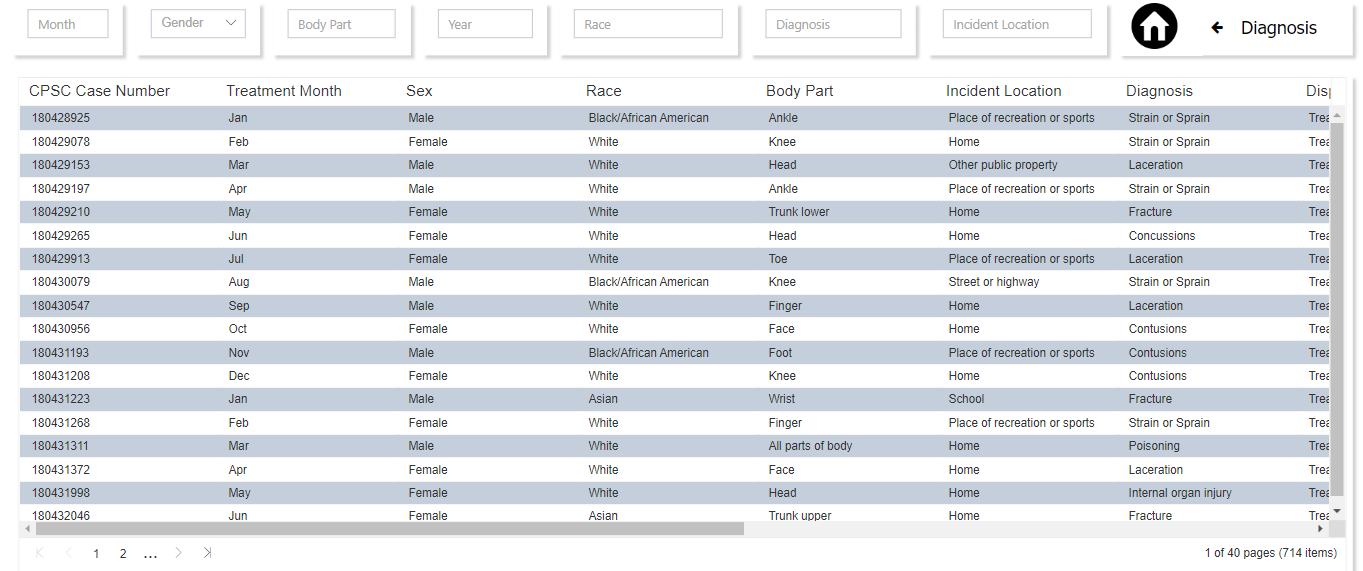
Detail Data Table: It displays all the information on Injuries like CPSC Case Number, Treatment Month, Sex, Race, Body Part, Incident Location, Diagnosis, Disposition, Body Part Code, Product, Age, History, and Weight.
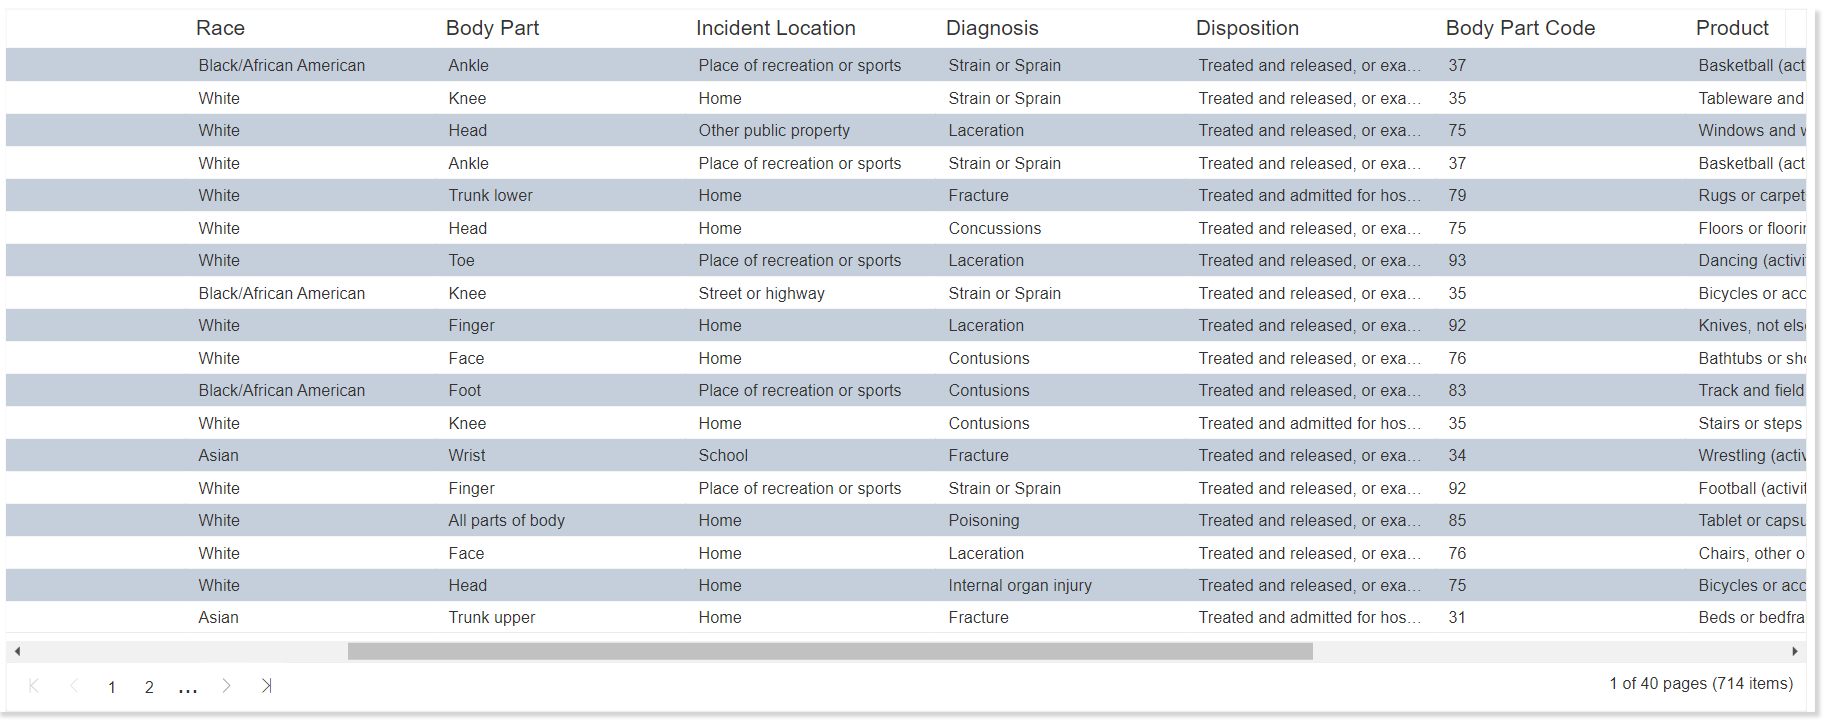
From the Right vertical menu select the Table widget and enter the following details in General Property.
Name: Diagnosis Body Part with History

Dataset: USA NEISS Data .ds

Header Height: 26

Row Height: 26

Dataset Column Select all the fields.
Go to the Widget Setting and enter the details same as Injuries Count by body Part widget Property.
Click on Save and Exit.
Go to the Formatting Property and enter the details in Miscellaneous Properties below:
Pagination: Eneble

Pagination Size: 18
Enter the details in Theme Properties below:
Table Header Properties >> Header font Size: 17

Table Body Properties >> Table font Size: 13

Odd Row Background color: #c5cfdc
Go to the Widget Setting and enter the details same as Injuries Count by body Part widget Property.
Click on Save and Exit.
Home Icon

From the right vertical menu add Custom Visualization Widget in the dashboard.
Enter the code in HTML Property (HTML code provided in home icon file)
Enter the code in JavaScript Property (JavaScript code provided in home icon file)
Enter the code in CSS Property (CSS code provided in home icon file)
Go to the Widget Setting and enter the details (follow the Widget setting property of Energy Utilized by Type chart)
Title Properties: Disable Show Title
Click on Save and Exit.
Diagnosis Button
From the right vertical menu add Custom Visualization Widget in the dashboard.
Enter the code in HTML Property (HTML code provided in diagnosis in detail data file)
Go to the Widget Setting and enter the details (follow the Widget setting property of Energy Utilized by Type chart)
Title Properties: Disable Show Title
Click on Save and Exit.